The decisions that most intimately shape your vending profitability aren’t made by your equipment dealer or product distributor—they’re made where your machine sits in relation to the nearest restroom, how many steps it takes to reach from the employee entrance, and whether the building owner views you as a tenant or a nuisance. Research from VendSoft’s 2025 profit analysis shows that location quality determines 84% of vending revenue, while machine age and features account for only 9% .
This location blindness creates a brutal paradox: the factor with the most direct impact on your cash flow receives the least critical thought. While we obsess over telemetry and card readers, the fundamental question of “Will someone who is thirsty, hungry, and has 90 seconds to spare actually walk to this exact spot?” goes unasked. Understanding how vending locations actually perform transforms you from an equipment owner into a behavioral economist.
The Invisible Architecture: How Location Psychology Controls Revenue
Every aspect of your vending machine’s performance rests on a foundation of human movement patterns and micro-convenience friction. The distance from parking to machine, the line of sight from the breakroom door, whether the machine faces the seating area or a blank wall—these aren’t trivial details but the invisible architecture that determines whether someone buys a $2.50 energy drink or walks 40 feet to their car for the grocery store.
Consider something as fundamental as the “captive audience coefficient.” A machine in a 500-employee manufacturing plant where workers can’t leave the premises during shifts has a captive coefficient of 1.0—these customers must use your machine or go without. A machine in a strip mall where customers can walk to the 7-Eleven next door has a coefficient of 0.2—they have alternatives. The same machine, same products, same pricing generates $600 monthly in the plant and $120 in the strip mall. The difference isn’t the machine—it’s the prison-like quality of the location .
The cumulative effect of these micro-decisions creates divergent outcomes. A machine placed 15 feet from the breakroom door in a high-traffic corridor sells 3-4x more than the same machine placed 50 feet down a hallway, even though both are “in the building” . A machine facing the seating area where people can see others using it creates social proof, increasing sales by 22% . The invisible geometry of human behavior determines your profit more than your product selection ever will.
The Location Decision Tree: What Controls Your Revenue Destiny
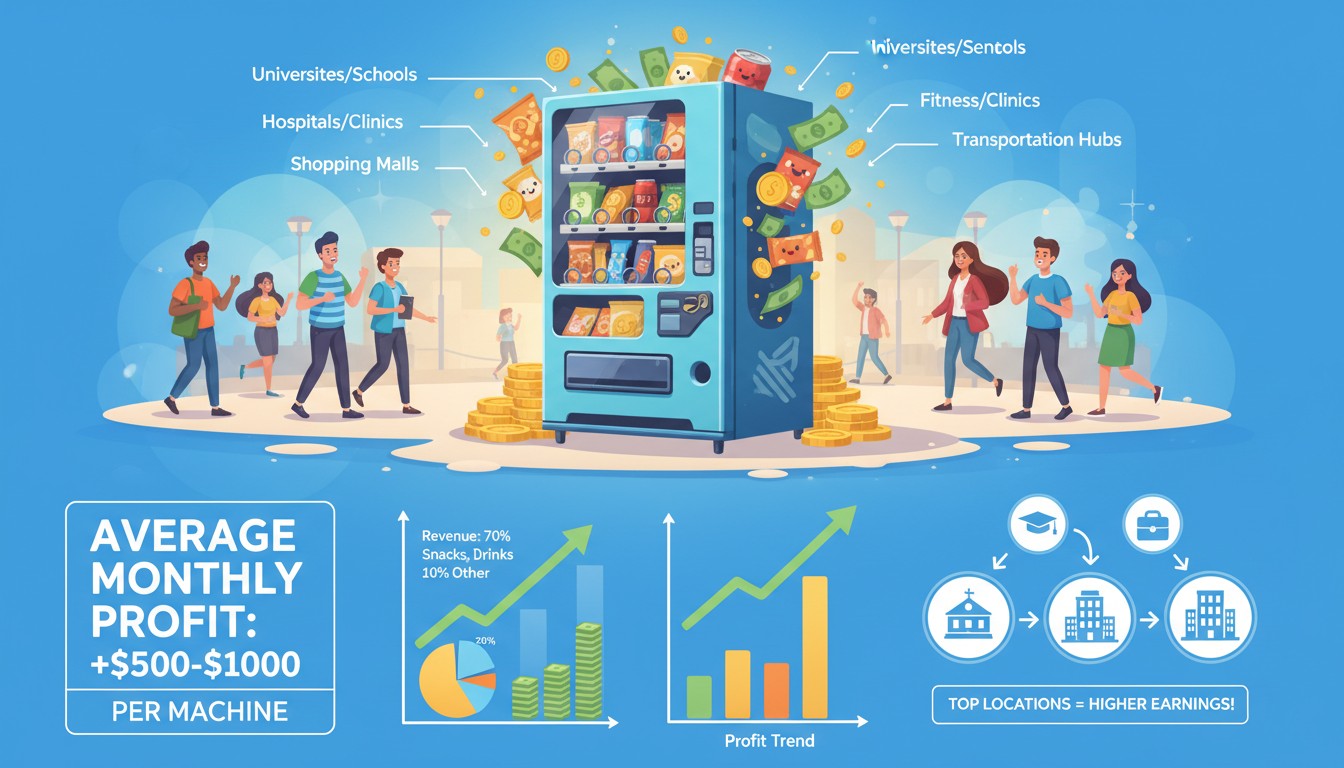
Manufacturing Plants (Gold Standard): 500+ employees, can’t leave during shift, captive coefficient 1.0, $500-$1,000 monthly revenue
Hospitals/Universities: High traffic, 24/7 operation, $400-$800 monthly revenue
Office Buildings: 100+ employees, dependent on breakroom location, $200-$500 monthly
Strip Malls/Retail: Low captivity, customers have alternatives, $100-$200 monthly (avoid)
Key Metric: Distance from primary customer congregation point should be <30 feet and require <5 steps out of natural path
The Psychology of Vending Failure: Why We Buy Machines Instead of Locations
If location is so critical, why do entrepreneurs consistently invest $4,000 in machines before securing a single proven site? The answer lies in a combination of equipment fetishism, fear of rejection, and a cognitive bias that overvalues technology over customer psychology.
The Equipment Fetish: Technology as Security Blanket
A $4,500 combo machine with telemetry, cashless reader, and LED lighting feels like a “real business.” It arrives in a truck, you unbox it, program it—it feels tangible and under your control. Asking a building manager for permission to place it means risking rejection. So we buy the machine first and figure out location later, which is like buying a Ferrari before you have a driver’s license. The equipment fetish provides false confidence that technology will overcome poor placement .
The Rejection Aversion: “I’ll Just Start with Easy Locations”
Cold-calling property managers is uncomfortable. So we place machines in “easy” locations—friends’ offices, our own workplace, strip malls that don’t require negotiation. These locations almost always underperform because they weren’t selected based on traffic analysis. The fear of hearing “no” costs you $400 monthly in lost revenue from a suboptimal location . Successful operators make 20-30 calls to secure 5-6 prime locations.
The Product Mix Delusion: “Healthy Snacks Will Differentiate Me”
New operators obsess over curating the perfect mix of organic bars and protein drinks, believing premium products will create demand. The harsh reality: location determines product viability, not the reverse. A manufacturing plant worker wants Monster Energy and Doritos, not kale chips. An office building trending younger might support healthier options, but only if the location is already strong . The product mix should be 80% proven sellers (Coke, chips, Snickers) and 20% experimental based on observed demographics.
Real Numbers: The Profitability Math That Matters
Let’s cut through the “passive income” fantasy with actual numbers from operators who track honestly:
The Single Machine Reality
Average machine in decent location:
- Monthly gross revenue: $200-$500
- COGS (40%): -$80 to -$200
- Location commission (10-25%): -$20 to -$125
- Fuel, vehicle, maintenance: -$30 to -$50
- Net profit: $70-$145 per month
A $4,000 machine at $100/month net profit takes 40 months to break even. This is why location is everything—cut commission to 10% and increase revenue to $600, and profit jumps to $250/month (16-month payback) .
The High-Performance Machine
Manufacturing plant with 800 employees:
- Monthly gross: $800-$1,200
- COGS (35% on higher volume): -$280 to -$420
- Commission (15%): -$120 to -$180
- Operating costs: -$40
- Net profit: $360-$560 per month
This machine pays for itself in 8-11 months. The difference? Location quality, not machine features.
The Scaling Math
Vending profits don’t scale linearly—they improve with route density :
- 5 machines: $250-$500/month profit (inefficient route, high fuel cost per machine)
- 10 machines: $600-$1,200/month profit (better route efficiency)
- 25 machines: $1,500-$3,000/month profit (optimized route, volume discounts on product)
- 50+ machines: $3,000-$6,000/month profit (potential for employee, established supplier relationships)
The Profitability Cascade
Initial Decision: Buy $4,500 machine without securing location
Month 1: Place in easy but low-traffic office, generate $180 revenue
Month 3: Net profit of $45/month, 100-month payback period
Month 6: Frustrated, consider quitting, machine becomes garage ornament
Opportunity Cost: $4,500 invested in prime location would be generating $400/month by month 6
Pre-Business Intelligence: The Location Assessment That Prevents Failure
1. The Captive Audience Test
Score each potential location 0-3:
- 3 points: Cannot leave premises during shift (manufacturing, distribution center)
- 2 points: Leaving requires significant effort (hospital, large university campus)
- 1 point: Leaving is possible but inconvenient (office building, retail)
- 0 points: Easy to leave and alternatives nearby (strip mall, public lobby)
Only pursue locations scoring 2 or 3 for your first machines .
2. The Distance Decay Analysis
Measure from primary customer congregation point (breakroom, entrance, time clock) to your potential machine location:
- 0-15 feet: High sales zone
- 15-30 feet: Moderate sales zone
- 30-50 feet: Low sales zone
- 50+ feet: Sales drop 60-80%
A machine 30 feet away in a low-traffic corridor sells 40% less than the same machine 10 feet from the breakroom door.
3. The Visibility Quotient
A machine in direct line of sight from where people sit or wait creates subconscious desire. Machines tucked around corners or behind pillars suffer from “out of sight, out of mind” syndrome. The visibility factor can increase sales 20-30% simply by being seen regularly .
The Location Assessment Checklist
Captive Score: 2-3 required for first machines (must have captive audience)
Distance: <30 feet from primary customer congregation point
Visibility: Direct line of sight from seating/waiting areas
Traffic Count: 100+ people per day minimum
Security: Indoor location preferred, or locked building with restricted access
The Execution Roadmap: From Zero to First $500 Month
Phase 1: Secure Location (Weeks 1-4)
Step 1: Identify 20 Target Locations
Use Google Maps to find manufacturing plants, hospitals, large office buildings, and universities within 30 miles. Create spreadsheet with contact info for facility managers .
Step 2: Make 50 Cold Calls
Script: “Hi, I’m a local vending operator offering commission-based machines for your facility. We handle all maintenance and stocking, and you receive 15% of sales. Can I speak with your facilities manager?” Expect 5-10% success rate .
Step 3: Site Visit and Assessment
Visit interested locations with your checklist. Take photos, measure distances, count foot traffic during peak hours. Decline 80% of “interested” locations—they won’t meet your criteria .
Phase 2: Secure Equipment (Weeks 3-6)
Step 4: Buy Used First
A used Crane or Dixie Narco combo machine costs $1,500-$2,500. Your first machine will make mistakes—let them happen on depreciated equipment. Upgrade to new ($4,000-$6,000) only after you have 3+ profitable locations .
Step 5: Stock Proven Products
80% proven sellers: Coke, Diet Coke, Mountain Dew, Gatorade, water, chips, Snickers, trail mix. 20% experiment based on location (protein bars in gyms, Pop-Tarts in factories) . Your first machine is not the place to test kale chips.
Phase 3: Launch and Optimize (Weeks 6-12)
Step 6: Install and Track Religiously
Use a simple spreadsheet or free app like VendSoft to track every product, every sale, every restock date. Data is your only compass .
Step 7: Service Weekly (Non-Negotiable)
Empty the cash box, wipe down the machine, rotate stale product, restock bestsellers. A machine that looks maintained sells 15% more .
Step 8: Optimize at Week 4
Review sales data. Replace slow movers with variations of fast movers. If Coke sells out in 3 days, add Cherry Coke. If protein bars sell 2 units in 2 weeks, replace with trail mix .
Real-World Performance: Vending Journeys
The Manufacturing Plant Machine That Became a Cash Cow
An operator placed a used $2,200 combo machine in a 600-employee automotive parts plant. The location was 20 feet from the time clock, visible from the breakroom. He stocked it with Monster, Coke, Doritos, and Pop-Tarts based on plant demographics. Monthly revenue stabilized at $850. After COGS (35%), commission (15%), and operating costs, net profit is $425/month. Payback period: 5.2 months. The machine has operated for 3 years with minimal issues.
The Office Lobby Machine That Flopped
A new operator placed a $4,500 new machine in a “high-traffic” office building lobby. The lobby was large and beautiful but machines were tucked behind a pillar 40 feet from the entrance. Monthly revenue: $140. After COGS, commission, and costs, net profit was $25/month. 180-month payback period. The operator moved the machine to a manufacturing plant after 6 months and it immediately began generating $600 monthly. The lobby wasn’t “high-traffic” for vending—it was a transient space where people walked through, not congregated .
The Route Builder Who Scaled to 30 Machines
Following the location matrix strategy, this operator secured 3 manufacturing plants in month 1. Month 2, he used revenue to buy 2 more used machines, placing them in additional plants. By month 6 he had 8 machines averaging $380 monthly profit each ($3,040 total). By month 18 he had 30 machines and hired a part-time route helper, paying himself $4,500 monthly while working 20 hours weekly. His secret: never placed a machine that didn’t score 2-3 on the captive audience test.
Troubleshooting Common Failures
Your Vending Success Is Hiding in Plain Sight
The vending machine business you’re considering isn’t about equipment or technology—it’s about understanding that humans are lazy, predictable creatures who will pay $2.50 for a Monster 20 feet from their workstation but won’t walk 50 feet to save $1.50. It’s about recognizing that a manufacturing plant with 400 employees who can’t leave during their 12-hour shift is worth 10 strip mall locations with “high foot traffic” but zero captivity.
Your power to build a profitable vending route doesn’t depend on capital or technical skills. It depends on one thing: your willingness to make 50 cold calls to secure 5 locations that actually meet the captive audience criteria, to measure foot traffic during site visits, and to track every single product sale with religious devotion. The machine will vend whether you understand location psychology or not. The customers will buy from someone. You can be the operator who builds a $6,000 monthly income from 30 machines, or the one who quits after 6 months because “vending doesn’t work.”
The choice is yours. Start now. Identify 20 manufacturing plants in your area. Call them today. Your vending empire begins with a single decision to stop buying equipment—and start buying location quality.
Key Takeaways
Location quality determines 84% of vending profitability—captive audience coefficient (ability to leave premises) and distance from congregation points are the critical metrics .
Cognitive biases like equipment fetish and rejection aversion cause operators to buy machines before securing locations, leading to 40-month payback periods instead of 8-12 months .
Realistic single-machine profit is $70-$145 monthly in average locations, $360-$560 in prime manufacturing plant locations—scaling to 30+ machines requires route density optimization .
Pre-business intelligence must include captive audience scoring (0-3 scale), distance decay analysis (<30 feet ideal), and visibility quotient before any equipment purchase .
Success requires systematic cold calling (50 calls for 5 locations), weekly service discipline, and data-driven product optimization—passive income is a myth without active management .